
The GLA Demography team produces a range of demographic projections to support planning and policy across London.
Two different approaches are used to produce the population projections:
Trend-based projections are an extrapolation of past trends in fertility, mortality, and migration patterns. Assumptions about housing are not explicitly included, though past development will have influenced the demographic trends on which the projections are based.
Housing-led projections incorporate explicit assumptions about the timing, quantity, and location of future housing development. Past trends are reconciled with the capacity of the available housing stock to arrive at a projected population that reflects both.
Included in the release
Trend-based population projections for local authority districts and regions in England and Wales to 2051.
Housing-led population projections to 2051 for electoral wards, Middle-layer Super Output Areas (MSOA), and local authorities in London.
A core set of variants are available for both trend and housing-led projections are available as Excel files from the London Datastore. The core variants of the housing-led projections can also be accessed through the interactive London Population Projections Explorer.
Detailed outputs and additional variants for use in analysis and modelling are available as csv files on the London Datastore.
Choice of projections
For general use, the GLA produces a core set of variants for both the trend-based and housing-led, designated as Central, High, and Low. These are intended to cover a reasonable range of possible outcomes and be suitable for use in common planning and policy activities.
The core variants for the 2024-based projections are based on the following scenarios:
Trend-based Central – central fertility scenario, central life expectancy scenario, migration patterns based on 13-years of past data
Trend-based Low - low fertility scenario, low life expectancy scenario, migration patterns based on 10-years of past data
Trend-based High - high fertility scenario, high life expectancy scenario, migration patterns based on 15-years of past data
Housing-led Central – central fertility scenario, central life expectancy scenario, migration patterns based on 13-years of past data
Housing-led Low - low fertility scenario, low life expectancy scenario, migration patterns based on 10-years of past data
Housing-led High - high fertility scenario, high life expectancy scenario, migration patterns based on 13-years of past data, constrained to the High variant of the trend-based projections.
The GLA generally suggests the housing-led population projections as the default for most purposes as they capture the potential impacts of future housing delivery and are available at a finer level of spatial detail.
Users are discouraged from relying on the results of a single projection. Where possible, it is good practice to consider the results of multiple variants, together with alternative sources, such as the Subnational Population Projections published by the Office for National Statistics.
Overview of the trend-based projections
The GLA’s trend-based population projections are produced using a multi-regional Cohort Component Model (CCM). This is similar type of model to that used by the Office for National Statistics to produce the official Subnational Population Projections (SNPP).
The cohort component approach is essentially a framework for accounting for population change through the mechanisms of births, deaths, and migration – often referred to as “components of change”.
Cohort component models typically begin with a base population estimate and then project forward one period at a time (a single year in this case), ageing-on the population, calculating births, deaths, and migration flows, and then accounting for the impact of these to arrive at the population for the end of the period.
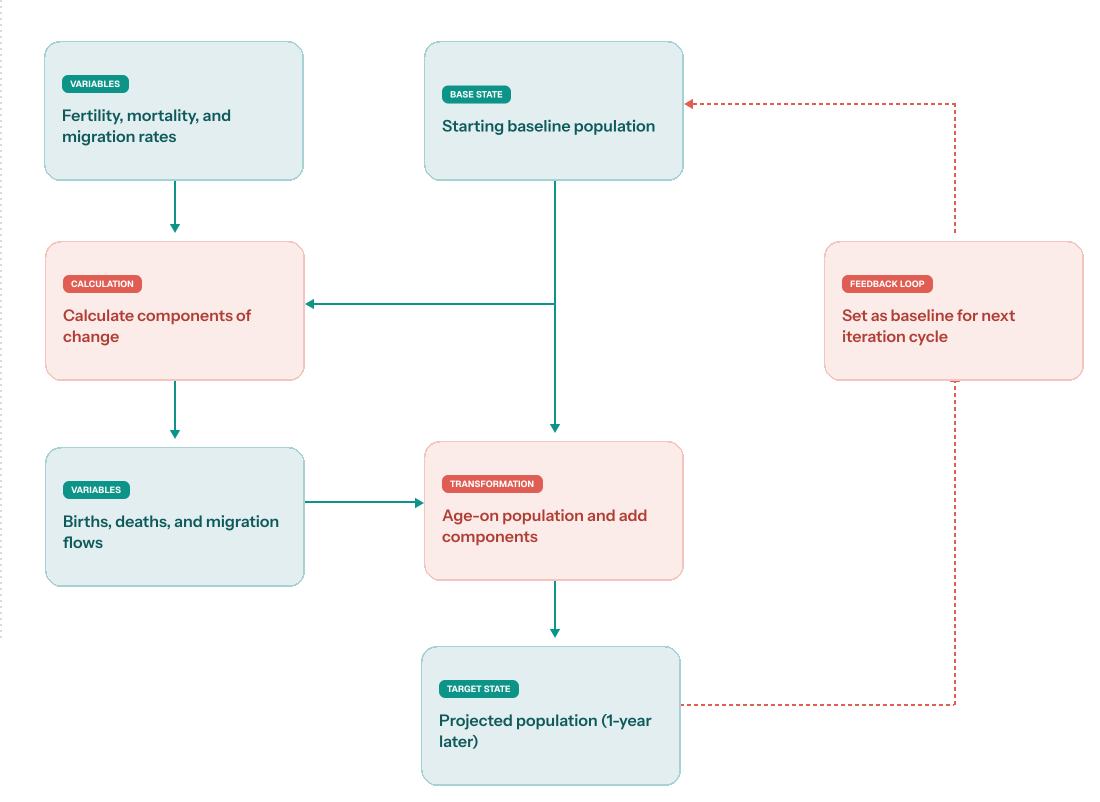
The GLA model is described as multi-regional because model areas are linked with one another through internal migration flows. A benefit of this approach is that internal inflows to each area reflect changes to the structure of the wider population and maintain the coherence of the projections across different geographic levels. This feature is important for projections that:
a) extend over a long period of time – where meaningful structural changes to the population are likely to occur
b) cover a large spatial area – where a lack of coherence in internal flows can distort the overall population.
In the GLA’s trend-based model – like many other cohort component models – the calculation of future demographic components is based on a continuation of patterns and trends derived from past estimates.
While such implementations of the cohort component approach don’t explicitly account for factors such as housing development or economic growth, the past influence of these on population change, particularly through migration, will tend to be reflected in the estimates on which assumed future behaviours are based. Projections based on demographic trends can therefore still include implicit assumptions about the future context.
The model natively operates at Local Authority District (LAD) level and includes all districts in England and Wales. The choice of local authorities as the primary geography is largely determined by the availability of suitable input data. Local authority districts are the lowest geographical level for which ONS publish annual estimates with detailed components of change that include annual migration flows.
Scotland and Northern Ireland are represented at country-level as individual areas within the model. However, as input data is not readily available in the same form and on the same schedule as for other areas, they are primarily included to maintain coherence of modelled internal migration flows and results for them are no longer routinely included in outputs.
Configuration
The results of the projections are largely dependent on the assumptions and methods used to generate the components. For the GLA’s projections:
Births and deaths are calculated by applying age-specific fertility and mortality rates to the population
Migration is split into international and internal flows:
International migration flows typically calculated as fixed annual flows that are independent of the population
Internal migration flows between each pair of local authorities are calculated by applying migration rates to the origin population.
The rates and flows used in the model are based on past estimates and assumptions about how past patterns will change in the future.
The GLA produces multiple variants of the projections based on different assumptions for each component. For general use, the GLA provides a ‘core’ set of variants, designated as Central, High, and Low. These are intended to cover a reasonable range of possible outcomes and be suitable for use in common planning and policy activities.
Additional projection variants based on a range of scenarios for each component are published on the London Datastore.
Age specific fertility rates are projected using a time series model that takes past age-specific fertility rates and produces distributions of possible future rates.
The fertility scenario used for the Central variant is based on the median values of this distribution. The scenarios used in the High and Low variants are based on the upper and lower bounds of the interquartile range of the distribution. In each case, the fertility rates are held fixed after 2032.
Age specific mortality rates used in the projections are based on the four scenarios included in the ONS 2024-based National Population Projections – Principal, Low, High, No Improvement (where ‘High’ refers to high life expectancy, i.e. low mortality). For each area in the model, these are scaled to fit recent estimates of deaths by sex.
Migration rates and flows are based on the averages of past estimates. Scenarios are based on different periods of past data, with the same period usually being used for each of the different migration components within a given scenario to reflect the fact that in/out/domestic/international flows are not independent of one another.
Unlike fertility and mortality, this approach does not produce explicit high and low scenarios – a given period may give higher net flows for one area, but lower for another. The choice of scenarios used in the core variants was made based on which periods provided an appropriate spread of net migration from the perspective of London.
For the 2024-based projections, these are:
Low – 10 years
Central – 13 years
High – 15 years
Overview of the housing-led projections
The GLA’s housing-led population projections incorporate explicit assumptions about the timing, quantity, and location of future housing development.
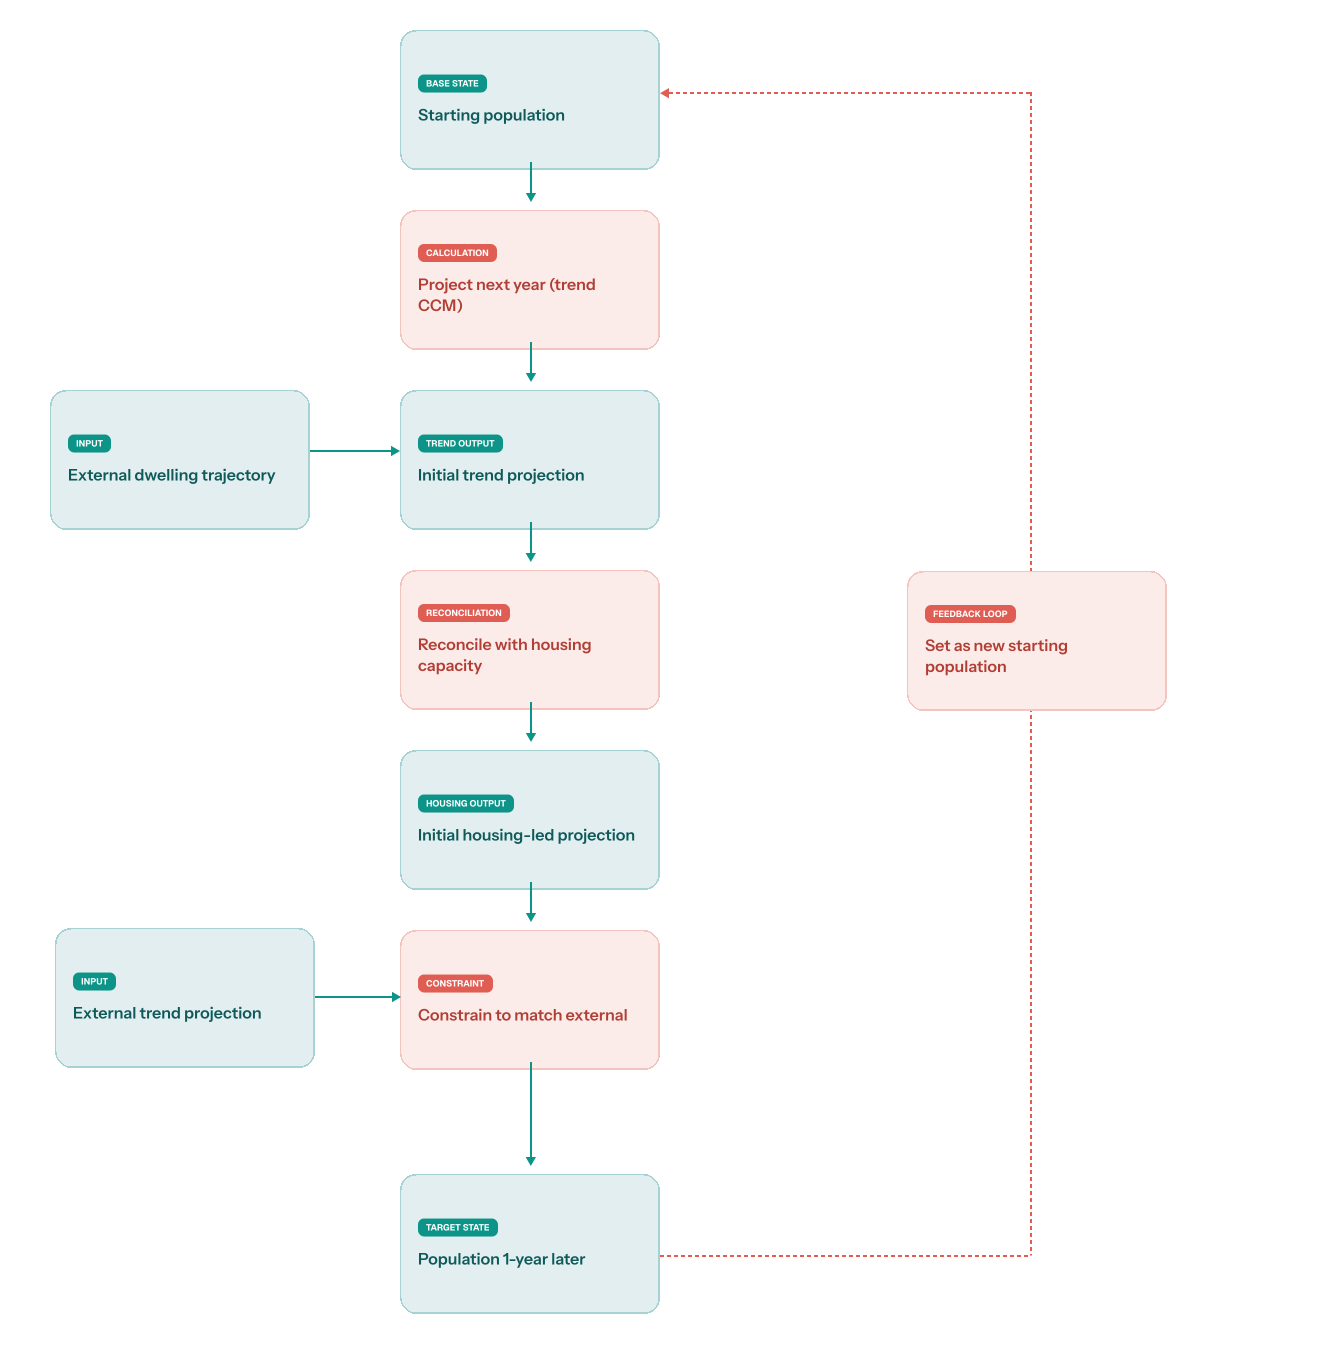
The model used by the GLA combines a simplified bi-regional cohort component model with a mechanism for reconciling trend-based population change with the capacity of the available housing stock.
As with the trend-based model, the housing-led model projects forward one year at a time from a base population, accounting for population change through the standard mechanisms of births, deaths, and migration.
Reconciling with housing capacity
In each annual ‘loop’ of the model, an initial projection for each area is generated in a similar way to how it is in the trend-based model. This initial projection is then reconciled with housing capacity using the following process:
Population is converted into households by removing assumed residents of communal establishments and applying a set of household representative rates to the remaining private household population. Average household size is calculated as the ratio of household population to households. This value is independent of the number of homes and the overall size of the population and is determined by the assumptions about household representative rates and communal establishment residents, and on the age structure of the initial population.
An alternative average household size is calculated by dividing the private household population by the assumed number of occupied homes, acting as a proxy for households. This value is independent of the age structure of the population and is determined by the total size of the population, the assumed number of communal establishment residents, and the assumed number of occupied homes.
A ‘target’ average household size is calculated by taking a weighted average of the values calculated in the previous two steps. This is then applied to the assumed number of occupied homes to calculate a target total population. The relative weights applied to the two household sizes are set by an external model parameter.
The migration components of the initial population are modified and reapplied to create an initial housing-led population for the area that is consistent with the target total population.
The method results in projections with the following characteristics:
The size of the population in an area will tend to increase or decrease in line with the assumed number of homes.
The size of the population relative to the number of dwellings is dependent on:
Local patterns of household formation
Assumed numbers of residents in communal establishments
Assumed proportions of homes occupied by ‘usually resident’ households (i.e. excluding vacancies, second homes, short-term lets)
Age structure of the population – e.g. with higher proportions of older adults resulting in smaller household sizes.
The resulting projections reflect a combination of local demographic trends, future housing development, and the existing way that the population forms households and occupies homes in each area.
An important limitation of the method is that it does not explicitly account for the characteristics, e.g. size and tenure, of the housing stock, relying on the characteristics of existing homes being implicitly reflected in past migration and household formation data.
As such, the results of the model will be less reliable in cases where large numbers of additional homes with characteristics that are significantly different to those of the existing stock are expected.
When planning major housing schemes, it is common to apply yield-based methods to understand the potential number and characteristics of future residents. While such approaches can provide valuable insights for individual schemes, they typically have limitations which make them less suitable for use at larger scales or over longer time horizons.
Constraining to an external population projection
The constraining process
The final stage of the annual loop is to ‘constrain’ the initial housing-led projection for each area to match the results of an external trend-based projection.
The process involves applying scaling to the initial housing-led projection, such that the results match (by age and sex) those of the trend-based projection when both are aggregated to a common ‘constraining geography’. Migration components are then adjusted to give annual change consistent with the constrained population.
Reasons for constraining
Coherence
The housing-led model is described as ‘bi-regional’ because migration flows are modelled between each area represented within the model and a ‘rest-of-the-world region’. This approach does not naturally reflect changes to the structure of the wider population in the composition of migration inflows.
Linking the housing-led model to the results of a projection produced using a full multi-regional approach ensures that coherence of the projections is maintained over time and across geographic levels.
Data limitations
Annual migration estimates are not published by ONS for areas below the level of local authority districts. For smaller areas, the model relies on ‘synthetic’ migration estimates, created by the GLA specifically for use in the model.
Net flows by age and sex, consistent with annual estimates of population, births, and deaths, published by ONS are relatively easy to calculate. However, cohort component models based on net migration typically have many limitations, particularly when trying to link them with housing capacity.
Breaking down net migration estimates into ‘realistic’ in- and out-flows allows for the creation of more effective models (even after allowing for the imperfections of this process).
However, while these synthetic flows are useful, they cannot be considered equivalent to the annual migration estimates published by ONS. By constraining to the trend-based projections, we aim to borrow strength from the large volume of migration data that underpin them.
Modelling approach used in previous rounds of projections
For the current London Plan, London’s overall assessed housing need was derived from and, therefore, naturally consistent with the GLA’s trend-based population and household projections. Similarly, for areas outside of London, assessed need and housing targets were typically informed by official trend-based projections of local population and household growth.
This allowed for several simplifying assumptions to be made in the projections:
That the overall population of London could be modelled using a purely trend-based methodology, with no need to separately account for additional population resulting from new housing.
That future housing development would affect the spatial distribution of population, but not its overall size and age structure.
That housing development occurring outside of London did not need to be accounted for in projections of population within it.
These assumptions were reflected in the design of the housing-led population model:
The projected population for each local area was directly linked to the capacity of the available housing stock.
The sum of the results of all individual areas within London were constrained to match the London-level results of the trend-based projections.
The extent of the model was limited to Greater London.
Updated approach for the 2024-based projections
While the projections are largely based on the same methods and models as previous outputs, some significant changes to assumptions and model configuration have been made to account for the government’s updated National Planning Policy Framework (NPPF).
The new standard method for calculating housing need specified in the NPPF is a departure from previous approaches in that the calculations no longer take demographic projections as their starting point, with housing need for each local authority being determined only by the existing number of homes and local housing affordability measures.
As the calculation of housing in the standard method is now independent of demographic projections, housing targets and trend-based projections are no longer naturally consistent with one another. Furthermore, for much of England, building in line with the standard method need figures would result in housing delivery that significantly outpaces the rate of growth in current demographic projections.
Early in the design of the 2024-based projections, it was determined that relying on the assumption that the population of Greater London will grow in line with trend-based projections was no longer appropriate. A priority in the development of an updated modelling approach was to ensure that it provided sufficient flexibility and could operate under a wider range of potential housing scenarios.
Without the previous simplifying assumptions that could be made under the old system, it is necessary to consider the relationship between housing and population at different geographic scales, where:
At very local level, there is a clear link, with new homes generally resulting in increases in population
At national level, any link is unclear and obscured by the impacts of other factors (e.g. migration policy)
Between these extremes the relationships are more complex. New homes may result in a clear addition to population in the immediate area, but we typically expect the size of the overall net addition to decrease as we consider the impacts over larger scales.
The residents of the new homes will have moved from somewhere else - many from nearby areas - and either vacated another home (with the whole household moving together) or left a smaller household in place at their previous residence (e.g. in the case of adult children leaving the parental home). The net impact of building new homes on population at different scales is, therefore, the result of a complex chain of moves and changes in household composition that ripple outward from the location of the new development.
While these dynamics are difficult to analyse in detail due to data limitations, the assumption that additionality from a specific development tends to decrease as the area considered increases seems reasonable because:
Building additional homes helps to reduce constraints on household formation - allowing the same population to form more, but smaller, households.
There are limits to how far the chain of moves triggered by new homes are likely to extend. A large development in, e.g., South London may have a measurable impact on moves within London and neighbouring counties but is unlikely to induce significant additional migration from the North of England.
This second point reflects the different drivers of short- and long-distance migration.
Long-distance or international moves tend to be linked to:
Pursuit of higher education
Employment opportunities
Relocation to be closer to family
Shorter distance moves, often labelled “residential mobility”, are primarily the result of changes to:
Housing needs, e.g. linked to life events such as family formation or separations
Tenures, e.g. purchasing a home and moving out of private rental accommodation
Priorities for amenities, e.g. moves to be closer to schools and green space after having children
We use this distinction as a basis for defining a set of Housing Market Areas (HMA), intended to represent areas where most moves within them can be considered as “residential mobility”, i.e. primarily driven by factors related to housing, and most moves between them can be considered as long-distance migration, where other factors dominate.
The updated approach is based on the assumption that the overall population of these housing market areas can be adequately determined using a trend-based model, with the housing-led model determining how population is distributed within them. Implicit in this assumption is the idea that housing outside of London, but within the same HMA, is considered substitutable for that within London.
For the 2024-based projections, the fundamental operation of the model remains largely unchanged from previous rounds, but the extent of the housing-led model has been expanded to cover the wider housing market area. As before, housing is accounted for in the initial projection of each individual area and then their combined populations are constrained to match the results of trend-based projections for the HMA.
Choice of housing market area geography
For the development of the 2024-based projections, the GLA constructed intermediate geographies based on work conducted by the National Housing and Planning Advisory Unit (NHPAU) and published by the Department of Communities and Local Government in 2010. This work aimed to define a set of housing market areas (HMAs) for England and Wales, constructing these areas around the notion of migration or commuting closure, where “‘closure’ means self-containment as measured by the proportion of such flows which do not cross the boundaries of the HMAs”.
The GLA has updated this approach with more recent commuting and migration data and created a tool that allows sets of housing market areas to be created for different levels of commuting and migration closure.
The main considerations in selecting the HMA geography used in the 2024-basd projections were that:
The housing market area containing London extended beyond the administrative region of London
The chosen areas meaningfully reflected underlying commuting and migration patterns
The areas used were based on a reproducible and open methodology and that alternatives could be readily created and tested for comparison
An HMA geography produced by the tool can be identified by the chosen threshold values of commuting and migration closure. The set of groupings used for the core variants are based on values of 56 percent for commuting closure and 45 percent for migration closure and are accordingly labelled as HMA5645. The HMA containing London is made up of a total of 91 districts.
Additional outputs have been produced on HMA7255, which is made up of fewer and larger areas. Here, the HMA containing London is comprised of 121 districts.
Housing assumptions
All published versions of the housing-led projections incorporate the same assumptions about future housing delivery in London, derived from the 2026 London Strategic Housing Land Availability Assessment, but use alternative scenarios assumed future housing deliver in surrounding districts.
Assumptions about housing delivery for areas outside of London are included in the model as a mechanism for adjusting the relative shares of the wider region’s population within and outside of London. These projections were produced without reference to current or future local plans or assessments of housing capacity in areas outside of London and in no way represent a view of likely future housing delivery in those areas. Where results for areas outside of London are included in the housing-led projections, it is for the purpose of providing transparency about the results for London itself and not as projections intended to be used for decision making within those areas.
For districts outside of London, the central assumption about future housing delivery was derived as follows:
Objectively assessed housing need for each district was calculated using the National Planning Policy Framework's Standard Method
Assumed housing delivery for each district was calculated by multiplying its Standard Method need figure by the ratio of London's assumed annual housing delivery to London's Standard Method need figure.
At the point the assumptions were set, this ratio was 63 percent (55,800/88,000) for the first ten years of the projection. For the low variant, housing delivery outside of London is assumed to be 15 percent higher than this, for the high variant it is assumed to be 15 percent lower
Population estimates
The estimates used in the projections are based on the official ONS mid-year population estimates series, but include adjustments made by the GLA.
Re-assignment of UPC
ONS ‘rebased’ past annual population estimates following the 2011 and 2021 censuses, adjusting them such that population change over the preceding decade was consistent with the estimates for the census years. In the process of creating these rebased estimates, ONS introduced an annual adjustment titled Unattributable Population Change (UPC) that was used to represent any change over the decade that they were unable to confidently assign to one of the standard components.
For some local authorities UPC is very large. Between 2012 and 2021, average annual adjustments ranged from –4.0k for Camden, to +2.6k for Ealing.
The use of UPC to explain past population change can be problematic when producing projections with models that don’t explicitly account for it. Any UPC in the past estimates is effectively ignored and has no bearing on the projected population. In cases where there is a substantial amount of UPC in the backseries, this tends to result in rates of projected future population change that are inconsistent with those seen in the period of past estimates on which the projections are based.
The produces an alternative series of population estimates for 2002 to 2021, which are based on the official ONS series, but with all change over the period explained by births, deaths and migration. Births, deaths, and internal migration are unchanged from their original values, and international flows are adjusted to account for all residual change.
Adjustments to estimates of children
A second set of adjustments are applied to account for issues identified in recent estimates of the number of children in the population. These issues are:
Underestimation of young children in the 2021 census. Because estimates for the period 2011 to 2021 were rebased to be consistent with the results of both censuses, this issue impacts estimates for years prior to 2021 as well as those produced subsequently.
Inflated estimates of annual net international migration of children from 2021-22 onwards.
Both issues are similar to those that affected ONS estimates over the course of the previous decade, though issues with migration estimates may be the result of different underlying mechanisms.
The GLA has applied adjustments to the estimates used in the latest projections with the priority being to mitigate the impacts to its work supporting local school place planning.
Adjustments are made to the estimates of population and international migration of children for all local authorities in England using a process that accounts for:
Children on roll in state funded schools by local authority of residence
Children on roll in independent schools by location of school
Numbers of children on the GP patient register
ONS revised official estimates in July 2026 to address some issues with estimates of children. The revisions reduced the number of children aged 0 to 15 in England by 135k for mid-2024. Users of the estimates are encouraged to check the latest documentation for more information
Small area population estimates
Population estimates for small areas are based on the published ONS series but are rescaled to be consistent with the local authority level estimates used.
Estimates for electoral wards are best-fit from estimates for Lower Super Output Areas (LSOA). This is less precise than fitting from Output Area data (which is how ward estimates published by ONS are produced). Some inputs to the model are not readily available below LSOA-level and the decision was made to prioritise the consistency of inputs to the model over the precision of fit of those that are available for Output Areas.
Users should be aware that ward-level outputs from the projections will not be fully consistent with other sources of published data for wards.